Principal Component Analysis - PCA
Unsupervised Learning
Overview
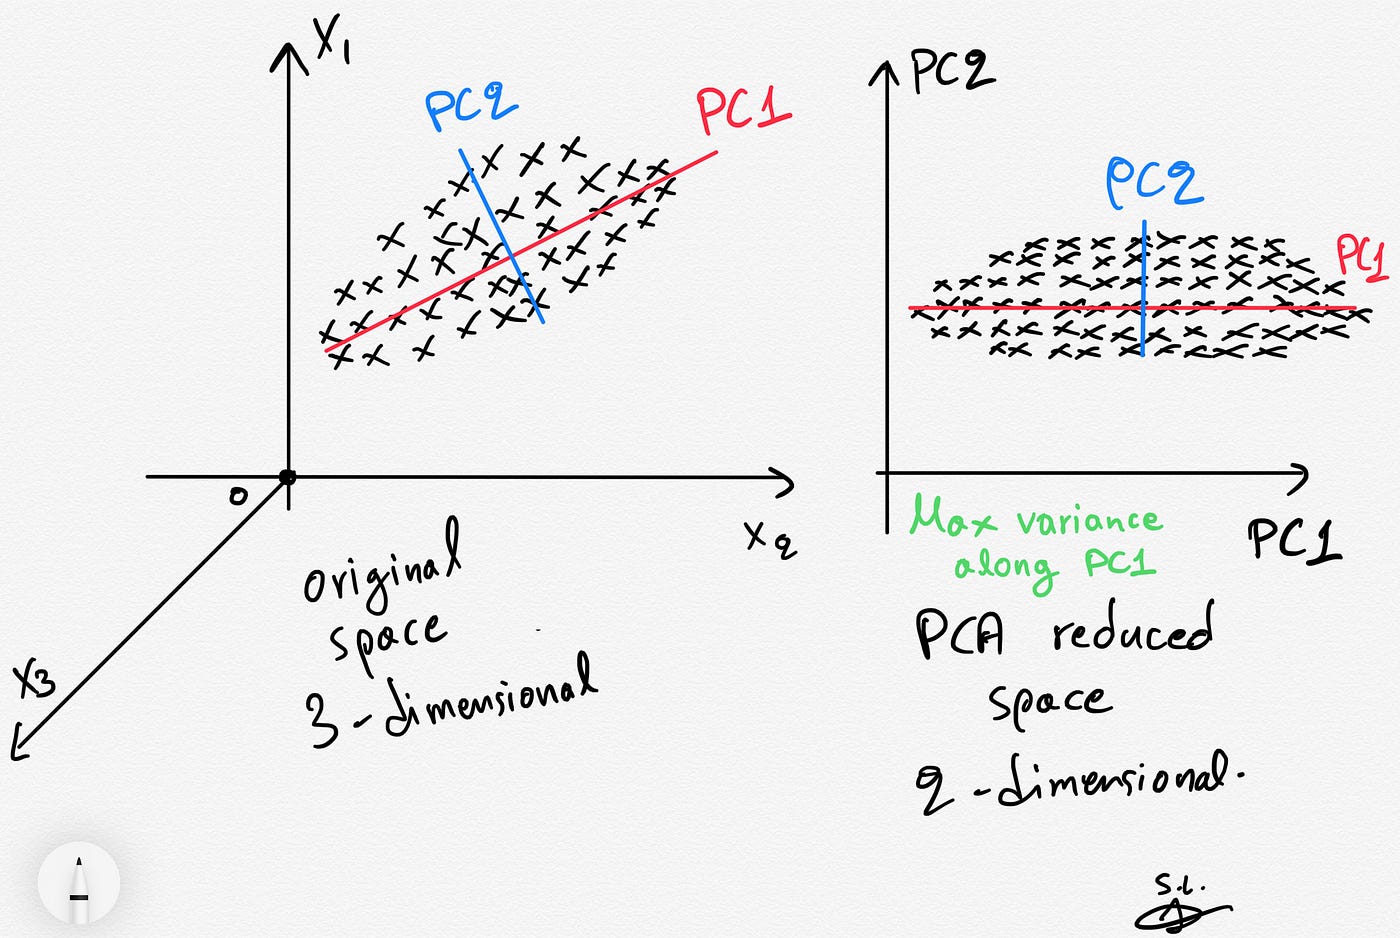
What is Principal Component Analysis (PCA)?
-
PCA is the machine-learning technique of taking a data set with large quantities of variables (features) and compressing it down into lower dimensions without any loss of important information.
-
PCA identifies correlations and patterns in the data to determine what columns to use to reduce into a smaller dimension.
-
PCA is a procedure that uses an orthogonal transformation to convert observations of correlated values into linearly independent components called principal components.
What are eigenvectors and eigenvalues?
By definition from Interactive Linear Algebra by Dan Margalit, Joseph Rabinoff
-
An eigenvector of A is a nonzero vector v in Rn such that Av=λv, for some scalar λ.
-
An eigenvalue of A is a scalar λ such that the equation Av=λv has a nontrivial solution.
How does PCA work?
-
Feature Standardization: Assuming all features have a mean of 0 and standard deviation of 1
-
Obtain the covariance matrix computation
-
Calculate the eigendecomposition of the covariance matrix
-
Sort eigenvalues from highest to lowest (higher values mean more variance in that component)
-
Select the number of principal components (based on eigenvalues)
Use cases for PCA
-
Visualizing multi-dimensional data (2D and 3D plots)
-
Compress information to transmit data faster
-
Clarify convoluted data
What are some of the benefits of PCA?
-
Easy computations for computers to perform
-
Speeds up other machine-learning algorithms because of the lower complexity of the model
-
Counteracts the overfitting issue of model analysis

Data Prep
The data set that will be used for PCA analysis will be the Kaggle Migraine data set. Please use the button above to download the data set!
For the PCA analysis, the data prep needed is to first remove any NA values, remove any categorical text-based values, and remove any egregious outliers. In this data set, there is Type which is a chr value which will need to be removed. Additionally, columns Hypoacusis, Diplopia, Defect, Ataxia, Conscience, and Paresthesia hardly had any values, so to remove some complexity as these will not really provide much information to the data set, they will be removed.

Uncleaned

Cleaned
Code
For the PCA analysis, it will be completed in R.
The first thing to do with PCA is calculate the correlation matrix from the normalized data frame.
This visualization of the correlation matrix generated shows the relationship of each component with each of the other components.
If the components are strongly correlated, the color will be red, if the components are not correlated, the color will be purple.
From this visualization, it seems that Character, Intensity, and Location are strongly correlated with each other and Phonophobia and Photophobia are strongly related to each other.

The next step in PCA is to calculate the eigendecomposition of in this case the correlation matrix and sort the values from lowest to highest.
The visualization to the right shows the breakdown of the eigenvalues of each component and how those eigenvalues represent the total data set.
For example, component 1 makes up 43.6% of the total explained variance.
This is a good way to visualize how many components to use.

Results

From the visualization above, there are four distinct component groupings:
-
Grouping 1: Character, Location, Intensity, Frequency, Vomiting
-
Grouping 2: Nausea, Photophobia, Phonophobia
-
Grouping 3: Visual, Sensory, Tinnitus, DPF, Vertigo
Component 1, against the x-axis, refers to patients Age.
Component 2, against the y-axis, refers to the duration of the migraine attack.
The stronger the color of red, the more important that principal component is, and the pinker it is the less important it is.
From the graph, it seems that Intensity and Location are strongly related which indicates that based on where the migraine is located, the stronger or weaker the headache may be.
It is not surprising that phonophobia and photophobia are related. Phonophobia is the aversion to loud sounds and photophobia is the aversion to lights or sensitivity to light especially of the eyes. When a patient is in pain due to their surroundings, it can trigger nausea symptoms. According to WebMD, 80% of migraine sufferers are sensitive to light. Interestingly, nausea is more closely tied with these two, the assumption made before starting PCA would it would have been that it was more closely related to intensity or duration.
Conclusion
In conclusion, this PCA analysis did provide some insight into what symptoms of migraines are related. From the research question:
-
Based on the location of migraines, can that be used to predict future migraine locations?
This PCA analysis wasn't able to directly predict future migraine locations, however, it was able to see combinations of symptoms that are more closely related that could then be applied to future patient records as a way to see what symptoms they most likely will be afflicted with based on the sample data set.
For future portions of the project, this gives insight into which symptoms are important and can be looked at more closely for future analysis. It will hopefully provide more insight into which medications work better for which symptoms!